Benford's Law analysis of the 2013 Venezuelan Presidential elections
The Venezuelan Presidential election results of 2012 and 2013 do follow Benford's Law.
Benford's Law describes the frequency distribution of digits in many natural sources of data and shows that such distributions are counter-intuitively not uniform. For example, Benford’s Law for the first digit states that the number "1" appears as the first (leading) digit about 30% of the time, the number "2" leads about 17% of the time, and so on. Benford's Law has been generalized for all digits, not only the leading one. This post considers Benford’s Law for the first digit (1BL) and second digit (2BL).
I took the vote counts for each candidate on the Venezuelan Presidential elections of 2013 (and 2012) and compared the frequency of their first and second digits against the predicted frequencies according to 1BL and 2BL. The vote counts were aggregated at different hierarchical levels: state (24 samples), municipality (335), parish (1,135), voting center (13,683), and voting table (39,018).
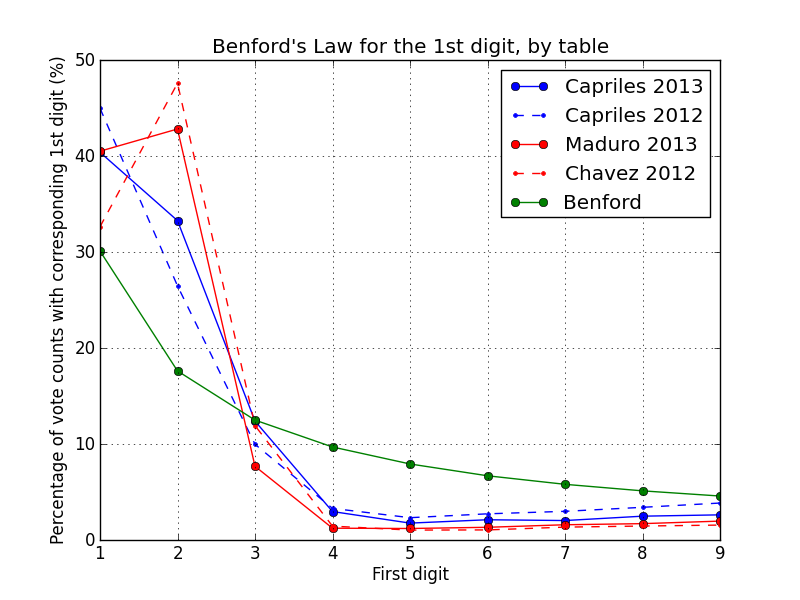
At the table level, it is clear that none of the candidates’ sample vote counts follow the predicted frequencies. A possible explanation for this result lies on the table sizes being too small (as measured by registered voters) and therefore constraining the data samples. Benford's Law can only apply to data sets where the sample space spans many orders of magnitude [?]. The voting table sizes in our data range from 26 to 603, with their size heavily skewed towards the upper limit of 600 (90% are between 300 and 600; 65% are between 500 and 600). Consequently, vote counts for either candidate lie in a similarly narrow range. In fact, vote counts for each candidate are normally distributed with a mean of ~200, with about about 80% of them lying between 100 and 300.
Size is not a limiting factor when votes are aggregated at the center or parish level though. For these levels of aggregation, we see the sample data follow 1BL closely.


I also performed the same analysis with respect to the second digit. Again, I see that center-level data follows the expected distribution closely, while table-level data does not.
All the graphs, as well as the code and data used to generate it are in my Venezuela GitHub repo.